Statistics
Community theatre statistics 2026
Sourced figures for volunteer community theatre in 2026. How many houses, what they spend, who volunteers, whether audiences came back, and published fees on a $25 ticket.
These are the numbers a board packet can actually cite. Association surveys, federal participation rates, and published rate cards. Not a vendor scorecard, and not a national headcount we do not have.
Every figure below names its source and the year it describes. If a popular claim does not appear here (a coast-to-coast audience total, a volunteer-army headline, an unpublished fee), that is on purpose.
Key takeaways
- AACT estimates well over 6,000 community theatres in the United States (AACT, association estimate, read 2026).
- In AACT’s 2023–24 trends survey (n=332), 70.7% of responding houses reported budgets under $250,000 (AACT, 2023–24).
- The same survey: 75.8% of houses have 299 seats or fewer (AACT, 2023–24).
- 75% of those houses reported a break-even or surplus budget (AACT, 2023–24).
- 45.1% saw a marked decrease in tech and general volunteers (AACT, 2023–24).
- In the 2026 Season Survey (n=110), the most common budget band was $100,000–$249,999, at 22.73% (AACT, 2025 survey for the 2026 season).
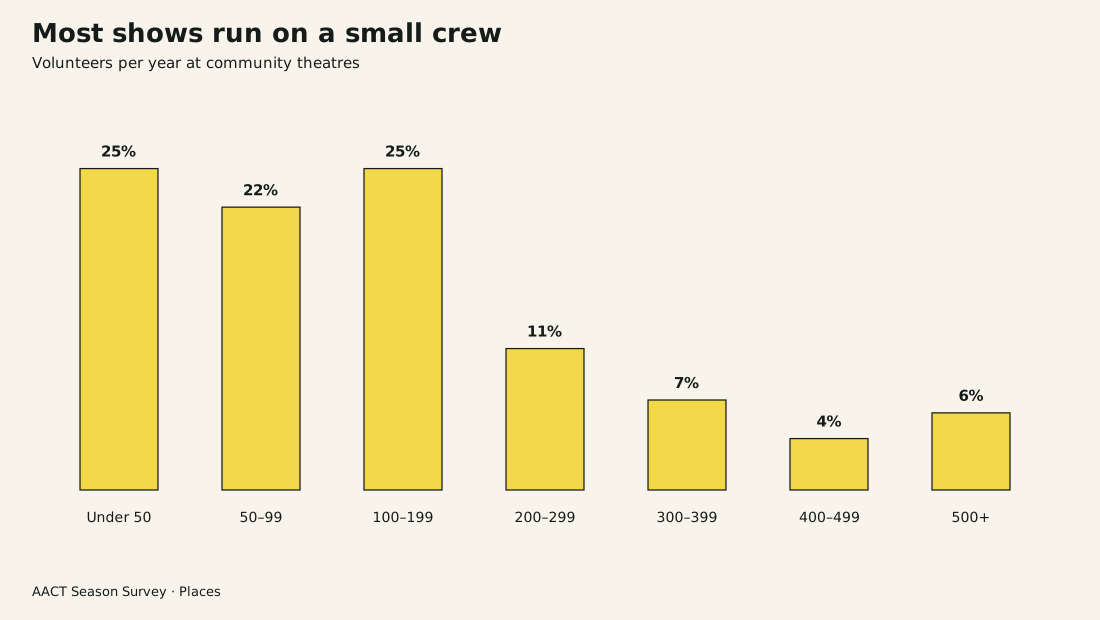
- About 72% of Season Survey houses reported fewer than 200 volunteers in a year (AACT, 2025).
- Among U.S. adults, musical stage-play attendance fell from 16.5% (2017) to 10.3% (2022). Non-musical plays fell from 9.4% to 4.5% (NEA SPPA, 2022).
- Independent Sector valued a U.S. volunteer hour at $34.79 in 2024 (Independent Sector, released 2025).
- Nonprofit arts and culture activity was $151.7 billion in 2022, supporting 2.6 million jobs (Americans for the Arts, AEP6). Broader arts and culture, including commercial work, was $1.17 trillion, or 4.2% of GDP, in 2023 (BEA).
How many community theatres are there?
AACT’s published estimate is well over 6,000 community theatres in the United States.
That is an association figure on AACT’s own impact page, not a building-by-building census. AACT’s history page is honest about how hard the count has always been. Groups start, go dark, and change names faster than anyone can keep a list. Treat “well over 6,000” as the association’s working estimate, not a headcount you can audit.
The two surveys on this page describe the houses that answered, not every house in the country. The 2026 Season Survey has 110 responses. The 2023–24 trends survey has 332. Both lean toward organizations already in AACT’s orbit.
What does a typical community theatre budget look like?
In the AACT 2026 Season Survey, the most common annual budget among 110 responding houses was $100,000–$249,999 (22.73%, 25 theatres).
The next band, $250,000–$499,999, is close behind at 19.09%. Fifteen percent of houses reported a budget under $25,000. Two houses reported $3 million or more. Zero reported $1.5–$2 million. Community theatre is not one budget. It is a folding-table season and a staffed building on the same survey page.
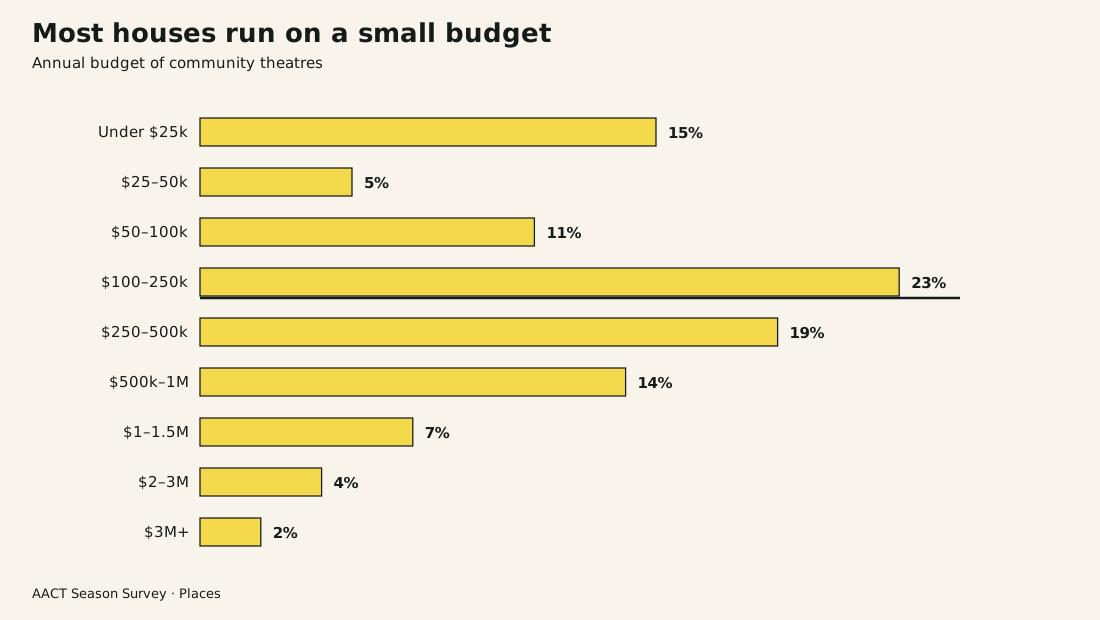
The larger 2023–24 trends survey (n=332) published a similar shape with coarser bands: 28.6% under $50,000, 18.1% at $50,000–$99,999, 23.9% at $100,000–$250,000. AACT’s own sum: 70.7% of responding houses under $250,000.
How many volunteers?
Most Season Survey houses run on fewer than 200 volunteers a year.
Question 14 asked how many volunteers the theatre generally has in a year. Of 110 answers, 28 houses (25.45%) reported fewer than 50, 24 (21.82%) reported 50–99, and 27 (24.55%) reported 100–199. That is 79 houses, about 72%, under 200. The chart rounds those bands to 25%, 22%, and 25%.
The trends survey, a year earlier and a larger sample, asked about change rather than headcount. 45.1% of those 332 houses reported a marked decrease in tech and general volunteers. 26.6% said the bench stayed the same. 15.2% saw an increase. Acting pools moved the other way: 40.7% reported an increase.
Independent Sector puts a dollar on an hour of that work. The national value of volunteer time was $34.79 in 2024, up from $23.07 in 2014.
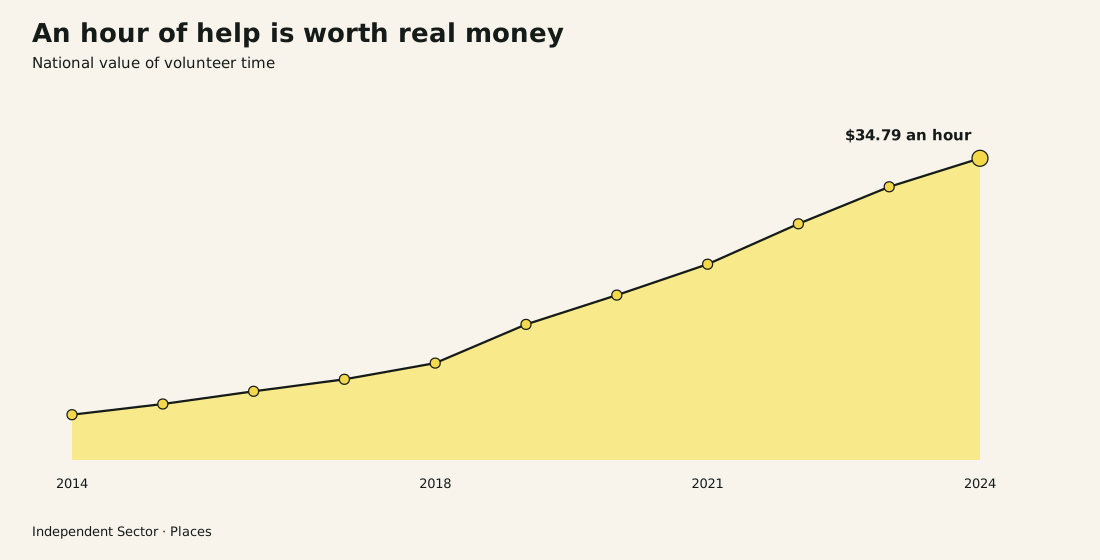
That rate is a national average of private-sector wages, not a community-theatre payroll. It is useful when a board wants a sense of what the unpaid hours would cost if they were paid. It is not a bill.
Are audiences recovering?
Live theatre attendance among U.S. adults has not returned to 2017 rates.
The National Endowment for the Arts Survey of Public Participation in the Arts asked U.S. adults whether they attended specific live events. Musical stage plays: 16.5% in 2017, 10.3% in 2022, a 38% drop. Non-musical stage plays: 9.4% to 4.5%, a 52% drop.
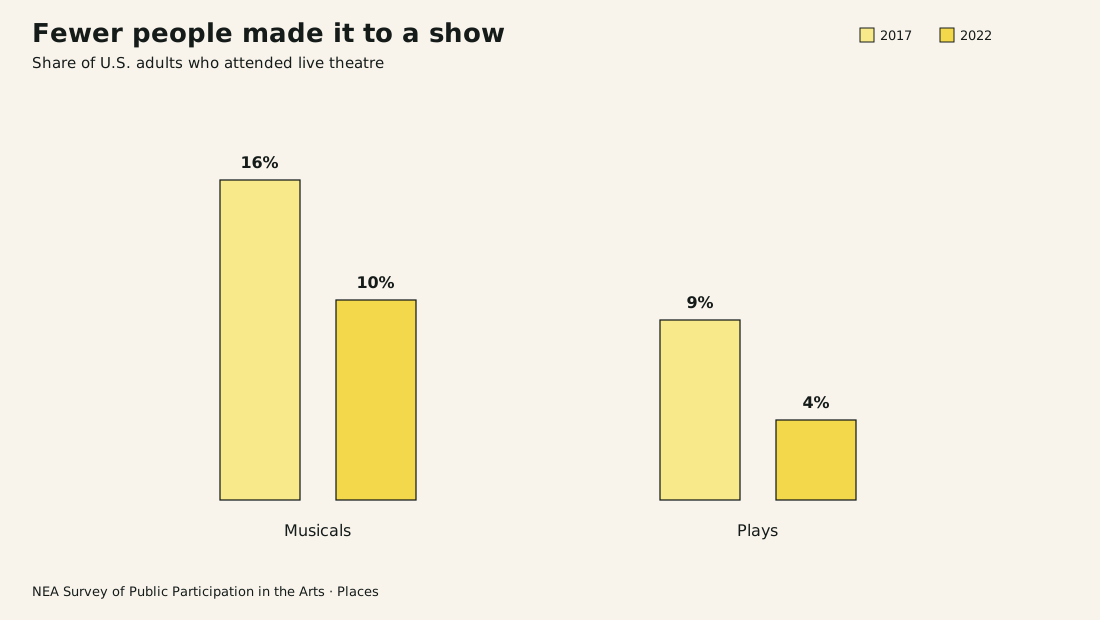
Read that chart as national adult participation, not as your Saturday. SPPA does not split community theatre from Broadway, touring, or a high-school auditorium. It does not give a U.S. community-theatre attendance total, and this page does not invent one. What it does say: fewer adults reported sitting in a theatre for a play in 2022 than in 2017.
AACT’s trends survey, asked of houses rather than of adults, is the closer picture of our door. 75% of those 332 theatres reported break-even or surplus budgets after Covid. The same write-up said 75% were seeing flat or decreasing sales over six years. Those two facts can sit together. A house can clear the year and still feel the seats.
Broader nonprofit arts economy
Nonprofit arts and culture is larger than a volunteer season, and smaller than the whole arts economy.
Americans for the Arts’ Arts & Economic Prosperity 6 study reported $151.7 billion in nonprofit arts and culture economic activity in 2022: $73.3 billion in organizational spending and $78.4 billion in audience spending tied to events. That activity supported 2.6 million jobs and $29.1 billion in tax revenue. AEP6 is the nonprofit arts and culture industry, not community theatre alone.
The Bureau of Economic Analysis measures a wider circle: nonprofit, commercial, and education. Arts and cultural economic activity accounted for 4.2% of U.S. GDP in 2023, or $1.17 trillion, and 5.4 million jobs. That includes streaming, publishing, and a lot of work that never sees a community stage.
Keep the two numbers on separate lines. $151.7 billion is the nonprofit study (2022). $1.17 trillion is the BEA satellite account (2023). Neither is a community-theatre box-office total.
Broadway vs community theatre
Broadway’s 2024–25 season is a commercial New York season. It is not a measure of community theatre.
The Broadway League reported $1.89 billion in grosses ($1,892,650,959) and 14,658,531 in attendance for 2024–25, with an average paid admission of $129.12. That is one district, paid tickets, a 53-week season.
Money
Broadway, 2024–25: $1.89 billion season gross.
Community theatre: no national box-office total is cited here.
Attendance
Broadway, 2024–25: 14.66 million paid.
Community theatre: no national attendance total is cited here.
Price / house
Broadway: $129.12 average paid admission.
Community theatre: 75.8% of AACT Trends respondents (n=332) have 299 seats or fewer.
How many houses
Broadway: one commercial district.
Community theatre: AACT estimate, well over 6,000 U.S. houses.
| Measure | Broadway, 2024–25 (League) | Community theatre (sourced) |
|---|---|---|
| Money | $1.89 billion season gross | No national community box-office total is cited here |
| Attendance | 14.66 million paid | No national community attendance total is cited here |
| Price / house | $129.12 average paid admission | 75.8% of AACT Trends respondents (n=332) have 299 seats or fewer |
| How many houses | One commercial district | AACT estimate: well over 6,000 U.S. community theatres |
Sources: Broadway League 2024–25 season wrap and detail table; AACT impact page and 2023–24 trends survey. As of 12 Sep 2026. Download the data (CSV).
A $25 community ticket and a $129 Broadway average are not the same product. A 200-seat volunteer house and a League season are not the same market. The useful contrast is scale and price, labeled as such. It is not a claim that community theatre “adds up” to Broadway.
What do ticketing fees look like at a community price point?
On a $25 ticket, the Places compare default, published per-ticket fees in this set run from $1 to $3.44. ThunderTix also has a monthly subscription, named on the bar, not drawn as height. The lines do not include the same things.
This is one worked example from published rate cards, not a ranking and not an Eventbrite-alternative page. Places is the vendor on the last bar. Tools are free. A reserved seat is $1. Comps are $0. General admission is free for early partners for a limited time.
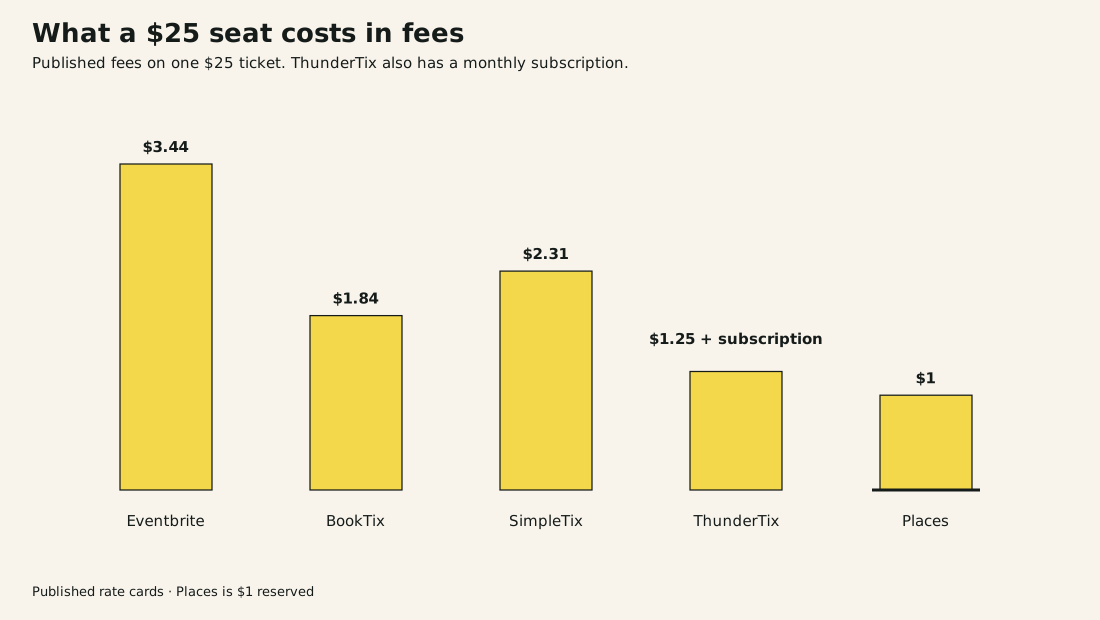
How each $25 bar was built:
- Eventbrite $3.44 (13.76%). Published 3.7% + $1.79 service, plus 2.9% processing. On $25: service $2.715 → $2.71, processing $0.725 → $0.73. Buyers pay by default on their public pricing page.
- BookTix $1.84 (7.35%). Published 3.75% + $0.90 per card ticket, processing included. Cash and comps free.
- SimpleTix $2.31 (9.26%). Published online fee 79¢ + 2% ($1.29), plus a processor example of 2.9% + $0.30 ($1.025 → $1.03). SimpleTix routes processing through the organizer’s Stripe, Square, or PayPal. That processing line is not SimpleTix’s platform fee.
- ThunderTix $1.25 + subscription. Published reserved seating is $1.25 per ticket plus $25 a month. The bar is $1.25, on the same scale as the other per-ticket lines. The subscription is written on the label. It is not drawn as height. Processing is outside the bar. Their GA line is $1.00 plus $20 a month.
- Places $1. One dollar on a reserved seat. Processing is TBD. Comps are $0, and general admission is free for early partners for a limited time. Places is the vendor on this bar.
On The Stage does not publish a formula we will treat as fact, so it is not on the chart. Compare is the page for named-vendor arithmetic with the calculator. What it costs to sell a ticket is the Places dollar without the other logos.
Methodology and update log
Last verified 12 Sep 2026. This page is a Places aggregation of primary sources. Places sells tickets. The fee chart includes our own $1 reserved-seat line and says so.
What we collected. Association surveys (AACT Season Survey for the 2026 season, n=110; AACT Community Theatre Trends 2023–24, n=332). Federal participation rates (NEA SPPA 2022 highlights). Nonprofit and whole-economy arts studies (AEP6 for 2022; BEA Arts and Cultural Production Satellite Account for 2023). A commercial Broadway season wrap (League, 2024–25). A national volunteer-hour series (Independent Sector, 2014–2024). Published ticketing rate cards read 21 Aug 2026.
What we did not collect. We did not invent a national community-theatre attendance total. We did not treat third-party headlines about “1.5 million volunteers,” “86 million in the audience,” or “$980 million” as AACT facts. We did not invent On The Stage dollars. Survey percentages describe respondents, not every U.S. house. SPPA describes U.S. adults, not your door. Broadway describes Broadway.
How the charts were drawn. Budget percents are the survey’s published figures, labeled to one decimal on the figure. Volunteer columns use the survey counts (28, 24, 27, 12, 8, 4, 7) and the rounded percents from the figure (25, 22, 25, 11, 7, 4, 6). Fee bars use the published formulas on a $25 face, the Places compare slider default. ThunderTix bar height is the $1.25 reserved fee. The monthly subscription is named on the label, not drawn as a second segment. Processing is called out when it sits outside the vendor’s own line. CSV files under /stats/data/ are the machine copy.
Update log
- 12 Sep 2026. Fee chart correction. ThunderTix bar height is $1.25 only. Label is $1.25 + subscription. Monthly dollars are not drawn on the bars. Places stays $1, with no plus.
- 12 Sep 2026. Fee chart correction. Places bar labeled $1, with no plus. ThunderTix stacked as $1.25 reserved plus $25/month in the figure. Processing for ThunderTix remains outside the bar.
- 12 Sep 2026. First publication. Sources listed on this page. Fee cards last read 21 Aug 2026 against the URLs above. Fee worked example uses a $25 face, the Places compare slider default.
If you are pricing a production, what it costs a community theatre to sell a ticket is the dollar. Apply if you can name the next show.
Frequently asked questions
- How many community theatres are there in the United States?
- AACT's published estimate is well over 6,000 community theatres. That is an association figure, not a counted census.
- What does a typical community theatre budget look like?
- In the AACT 2026 Season Survey (110 houses), the most common budget band was $100,000–$249,999. In the larger 2023–24 trends survey (332 houses), 70.7% reported budgets under $250,000.
- How many volunteers does a community theatre have?
- About 72% of Season Survey houses (n=110) reported fewer than 200 volunteers in a year. Independent Sector valued a U.S. volunteer hour at $34.79 in 2024.
- Are live theatre audiences recovering?
- Among U.S. adults, musical stage-play attendance fell from 16.5% in 2017 to 10.3% in 2022. Non-musical plays fell from 9.4% to 4.5%. Those are national adult rates, not a community-theatre door count.
- What does Places charge compared with published ticketing fees?
- Places is the vendor on that comparison. Tools are free. A reserved seat is $1. Comps are $0. General admission is free for early partners for a limited time. ThunderTix reserved is $1.25 per ticket plus a monthly subscription. The fee bar is $1.25. On a $25 ticket, the Places compare default, published Eventbrite, BookTix, SimpleTix, and ThunderTix lines are listed with sources on this page.